My Latest Dashboards
Take a look at my recent work.
Bank Loan Report Dashboard
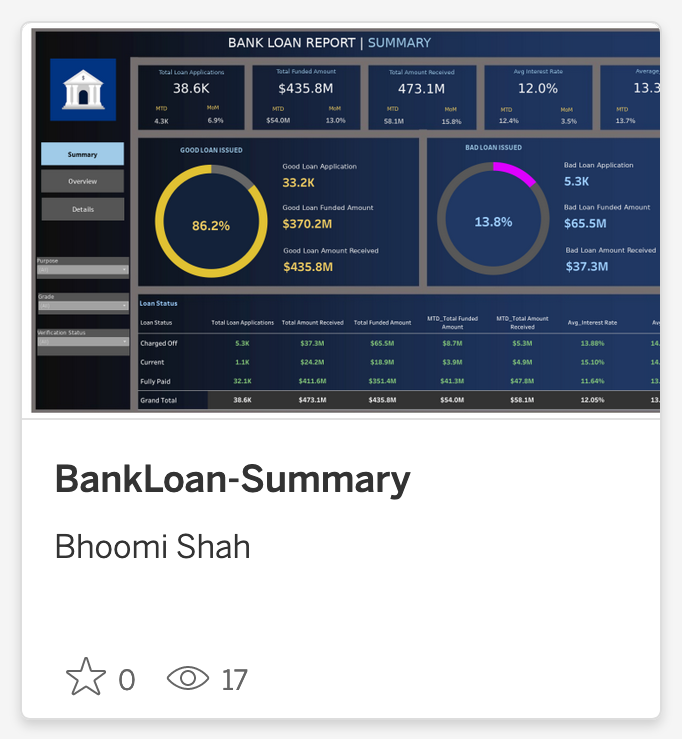
This Tableau project includes three dashboards analyzing bank loan data. Key performance indicators, calculated using SQL, provide insights into loan distribution and performance. The dashboards compare good versus bad loans, break down funded amounts by various factors, and list specific data points. This analysis helps the bank identify trends, optimize loan strategies, and improve financial performance.
Web Marketing Dashboard
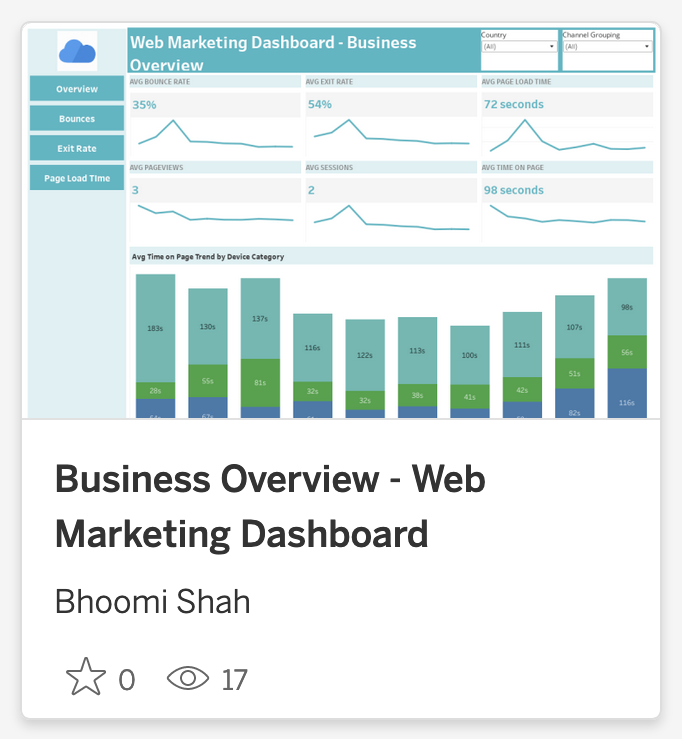
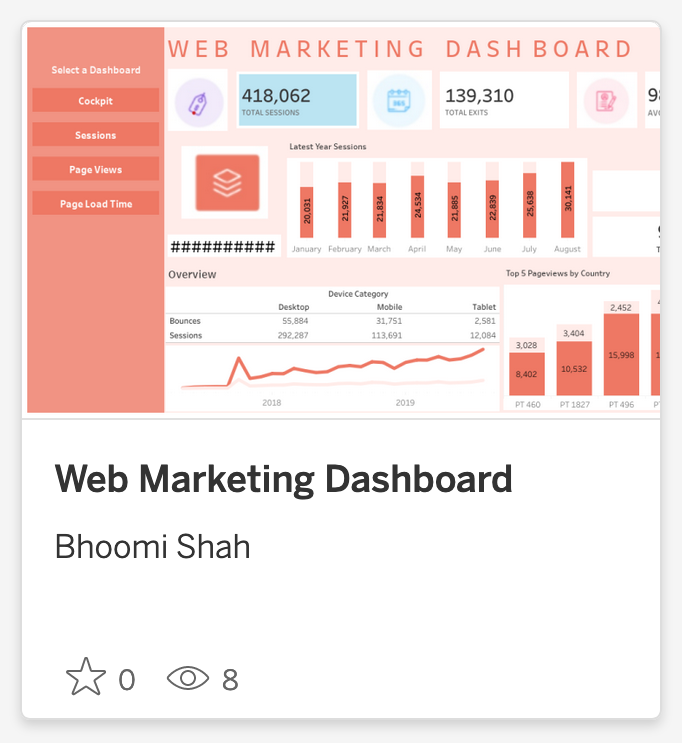
This Tableau project delivers crucial insights into website performance, offering a detailed analysis of key metrics like bounce rate, exit rate, page load time, pageviews, and time on page. By breaking down average time on page by device category and country, this dashboard reveals which devices and regions may need optimization. Understanding these patterns enables targeted improvements to landing pages and overall site design. This project empowers marketing teams to tailor strategies based on user behavior, enhancing the user experience, increasing engagement, and driving better business outcomes.
Twitter (X) Social Media Dashboard
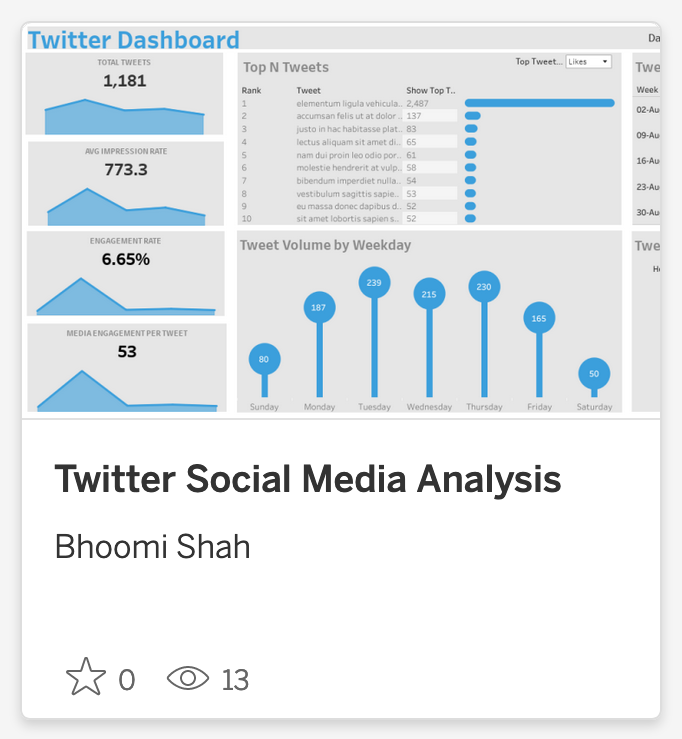
This dashboard drives business impact by identifying high-performing content, optimizing tweet timing, and refining engagement strategies. Key metrics include total tweets, average impression rate, engagement rate, media engagement per tweet, and top tweets. By analyzing tweet volume by weekday and content color, businesses can tailor their strategies to boost interaction, enhance visibility, and improve overall social media performance.
London Bus Safety Dashboard
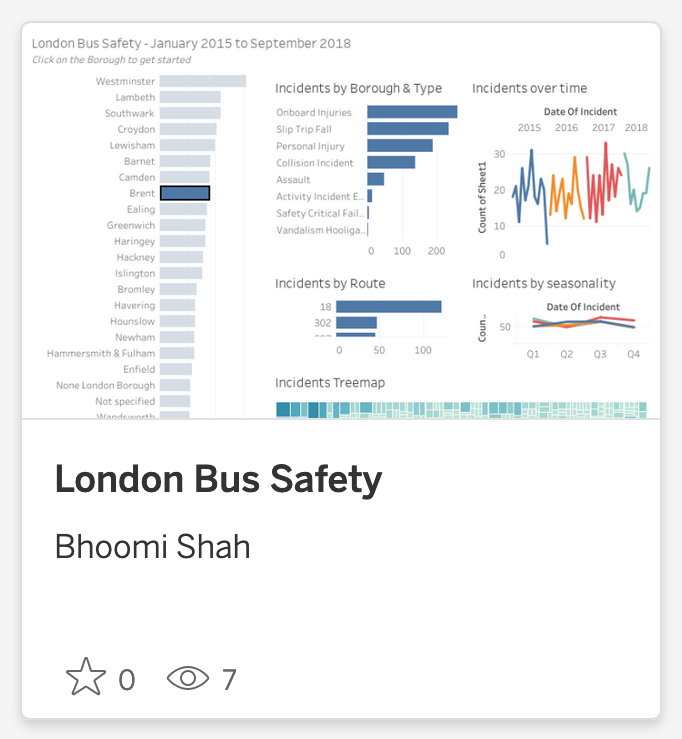
The London Bus Safety dashboard provides a detailed view of bus safety incidents through metrics like incidents over time, by borough and type, by route, and seasonality, along with an incidents treemap. It enhances safety awareness, supports data-driven decision-making, identifies patterns for proactive measures, and aids in transparent public communication. This comprehensive analysis helps optimize resource allocation by pinpointing areas with higher incident rates.
Web Marketing Dashboard
This Tableau project provides a comprehensive analysis of website performance with key metrics including total sessions, exits, average time on page, page load time, and total bounces, along with a breakdown by device category. By revealing patterns in user behavior and site efficiency, the dashboard identifies opportunities for optimizing landing pages and improving overall user experience. These insights support targeted marketing strategies, enhance engagement, and drive business growth through better site performance and reduced bounce rates.
Customer Analysis Dashboard
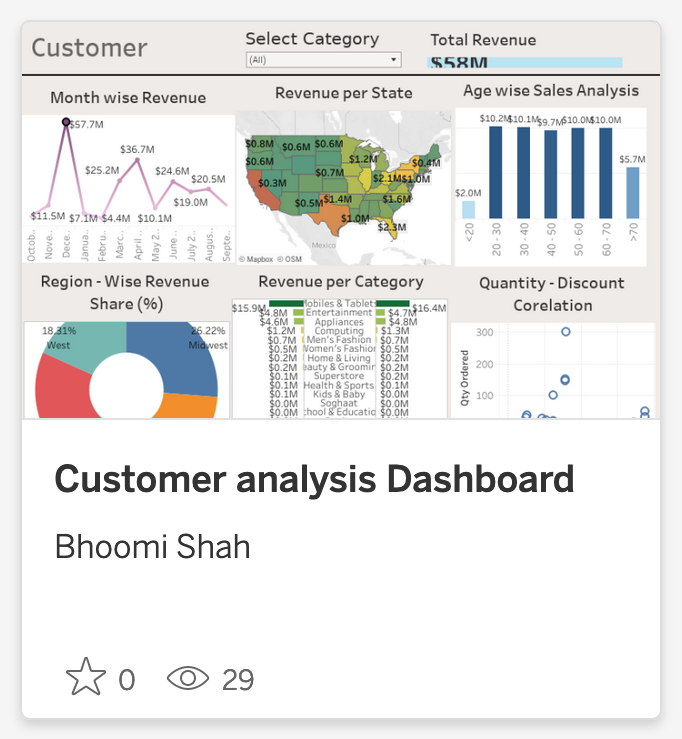
This dashboard was one of the first ones that I made. It delivers crucial insights into month-wise revenue, regional revenue share, state-specific revenue, category performance, age-based sales trends, and the correlation between quantity and discount. By examining these granular details, businesses can pinpoint high-value markets, refine pricing strategies, and tailor marketing campaigns. This targeted approach enhances sales efficiency, drives growth, and enables more informed decision-making, ultimately boosting overall revenue and profitability.
